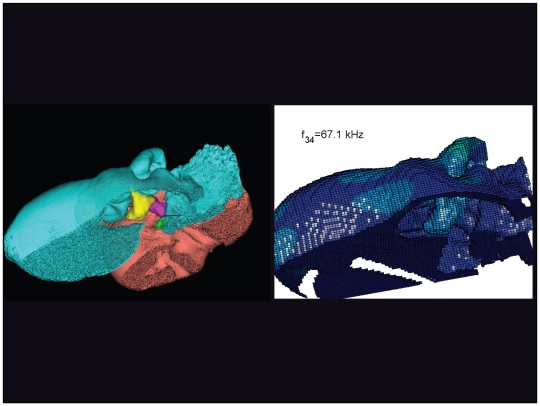
Figure 26. An inverted view of the TPC from Tursiops truncatus at 67.1 kHz.
The entire TPC was included during the calculation, but the medial portion was removed to facilitate viewing the middle ear ossicles. This simulated vibrational pattern represents the 34th natural mode of vibration. This figure is linked to the animation sequence that depicts the vibrational mode (Figure S26). The vibrations have been exaggerated for easier viewing (see methods section).

