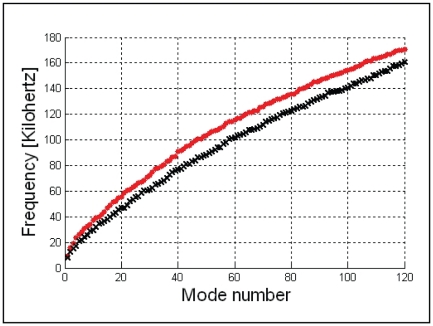
Figure 35. The difference between the “wet” (black crosses) and “dry” (red circles) vibrational modes.
These differences span the range of frequencies that were calculated for the first 120 modes. It shows that adding a layer of soft tissue to the lateral aspect of the TPC (wet) causes a slight shift in the frequency.

