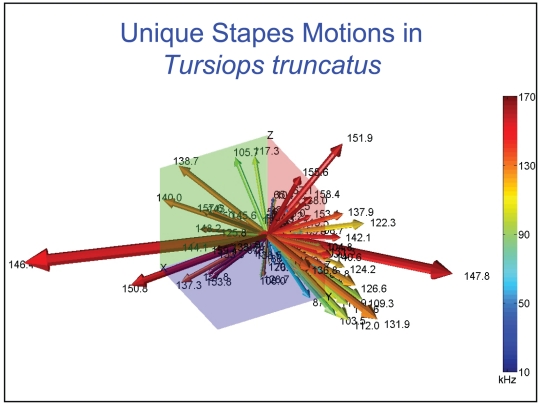
Figure 36. Unique motions of the head of the stapes in the Atlantic Bottlenose Dolphin (Tursiops truncatus).
Vector arrows show the relative magnitude and direction of motions at the head of the stapes for each natural mode of vibration or resonant frequency (the frequency is indicated by the numbers at each arrowhead). The Z axis runs through the head of the stapes and is more or less perpendicular to the footplate, which is in the XY plane. Colors code for frequencies: blue is low-frequency (on the order of 10 kHz), and red is high-frequency (∼60 kHz). Numbers associated with the arrows indicate the corresponding frequency. The vector arrows demonstrate that the complex vibrational patterns are unique for each natural mode of vibration and may be uniquely coded in the inner ear.

