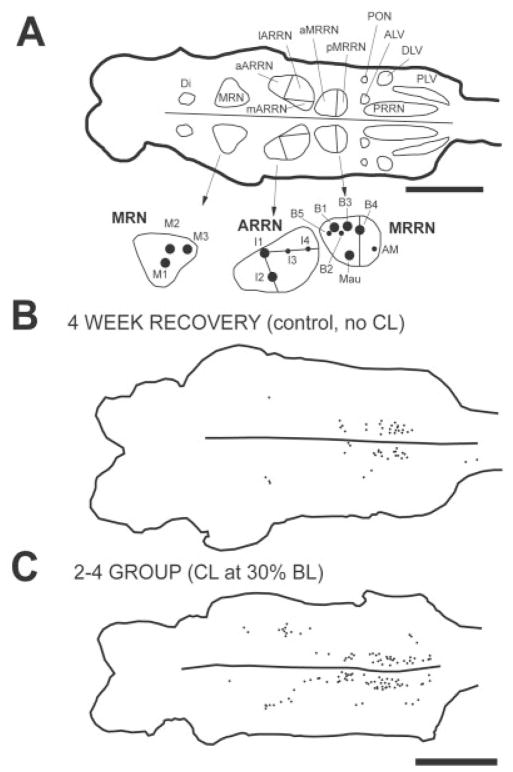
Fig. 2.
A (top): Diagram of dorsal view of a brain from a normal larval lamprey (left is rostral, and right is caudal) that was generated by a computer charting system (CCS; Tourtellotte et al., 1989). Outlines of different cell groups were drawn around descending brain neurons that were retrogradely labeled by application of HRP to the spinal cord at 20% BL in a normal animal (see Materials and Methods). A (bottom): Enlargement of MRN, ARRN, and MRRN on the left side of the brain, showing large, identified Müller and Mauthner cells: M1–M3, mesencephalic cells; I1–I4, isthmus cells; B1–B5, bulbar cells; Mau, Mauthner cell; and AM, auxiliary Mauthner cell. B: Computer-generated diagram of the brain from a control animal showing descending brain neurons (dots) that were labeled by application of HRP to the spinal cord at 20% BL at 4 weeks after a spinal cord transection at 10% BL (see Fig. 1A). C: Labeled descending brain neurons (dots) in an animal in the D-R = 2–4 experimental group with a CL at 30% BL (see Fig. 1B). Scale bars = 1 mm.

