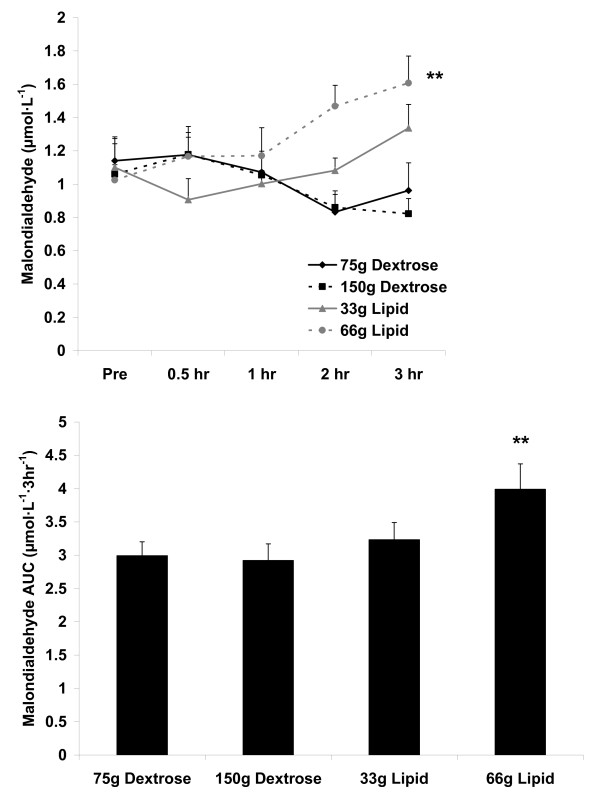
Figure 3.
Blood malondialdehyde before and following the consumption of a dextrose or lipid meal in young healthy men. Data are mean ± SEM. **Meal effect (p = 0.004); 66 g Lipid > 75 g Dextrose and 150 g Dextrose. Time effect (p = 0.72). Meal × Time effect (p = 0.02). **AUC effect (p = 0.04); 66 g Lipid > 75 g Dextrose and 150 g Dextrose.

