Fig. 2.

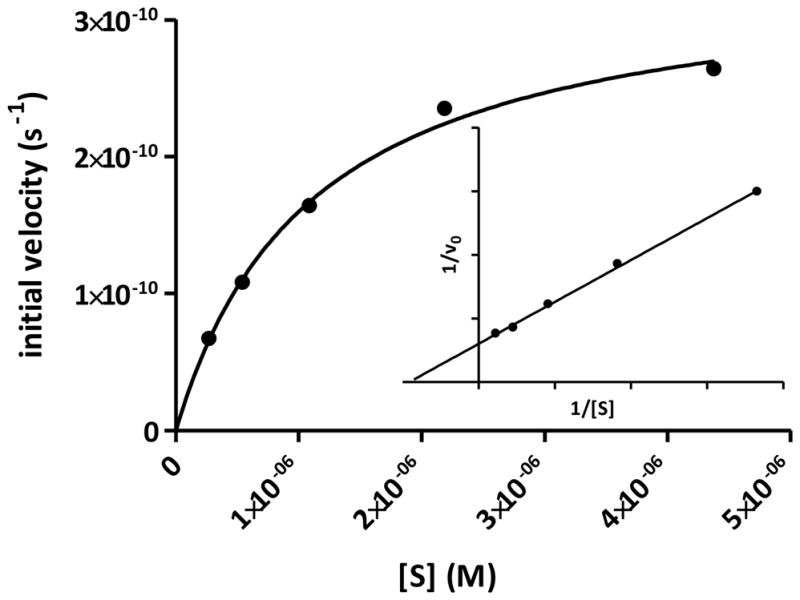
Nonlinear fit of initial velocity with respect to substrate concentration and the corresponding Lineweaver-Burk plot (insert). Substrate concentrations varied from 270 nM to 35 μM.

Nonlinear fit of initial velocity with respect to substrate concentration and the corresponding Lineweaver-Burk plot (insert). Substrate concentrations varied from 270 nM to 35 μM.