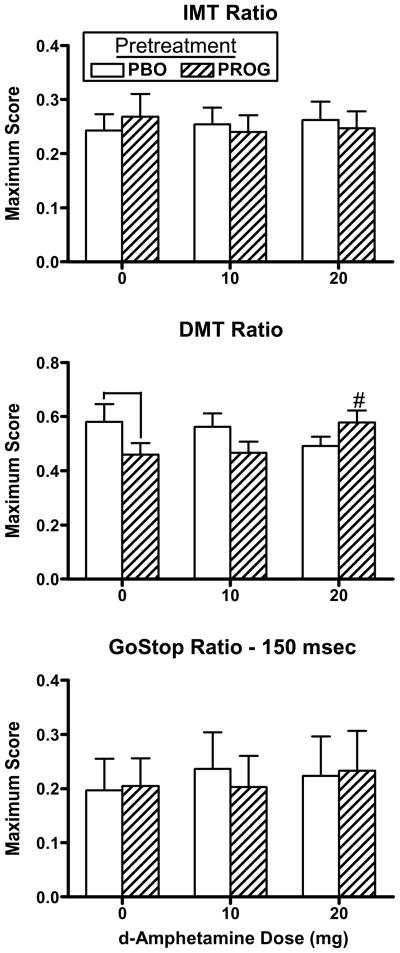
Fig. 4.
Peak IMT ratio, DMT ratio and GoStop ratio as a function of pretreatment and AMPH dose. # denotes a significant difference compared to 0 mg AMPH after progesterone pretreatment (p ≤ 0.05). ⊓ denotes a significant difference between pretreatments at that AMPH dose (p ≤ 0.05). Error bars represent + 1 SEM.

