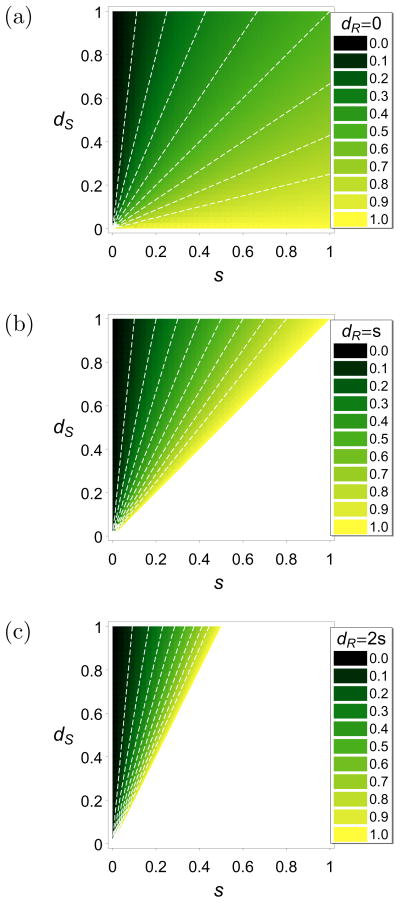
Figure 3.
Density plots for the threshold value for α. If α is beyond this value the resistant allele will become fixed. The fitnesses are parameterized as in (5). In the white regions the resistant allele is deleterious and gets lost for all values of α. The parameter dR is specified in the plot legends. The color code is shown in the panels. The white, dashed contour lines are at 0.1, 0.2, 0.3, 0.4, 0.5, 0.6, 0.7, 0.8, and 0.9, respectively.

