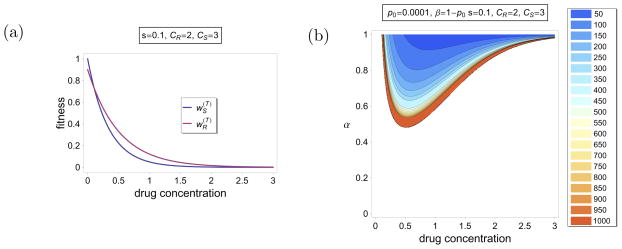
Figure 5.
Illustration of Example 2. (a) Fitnesses of the resistant and sensitive alleles as functions of the drug concentration give by (8). The parameters are specified in the label panel. (b) Contour plot of the time to quasi-fixation. The color code is shown on the right in numbers of generations. In the white region the resistant allele cannot be maintained in the population. The parameters are specified in the label panel. The fintesses are as in (a).

