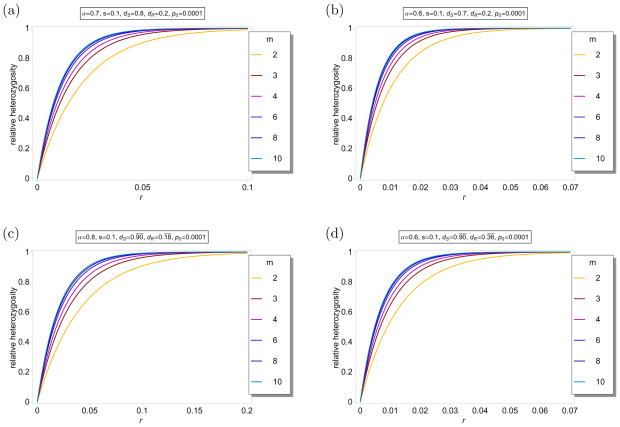
Figure 7.
Average relative heterozygosity ℋ(m)(r) as a function of r for different values of m for the model accounting for host heterogeneity. The fitnesses are chosen as in Example 3, with N = 10. Hence, there are eleven host classes. The parameters are indicated in the different panels. In figures (a) and (b), the parameters are chosen as in Figures 6(a), and (b), respectively. In figures (c) and (d), the parameters are chosen such that λ and μ are equal to the corresponding values in Figures 6(c), and (d), respectively.

