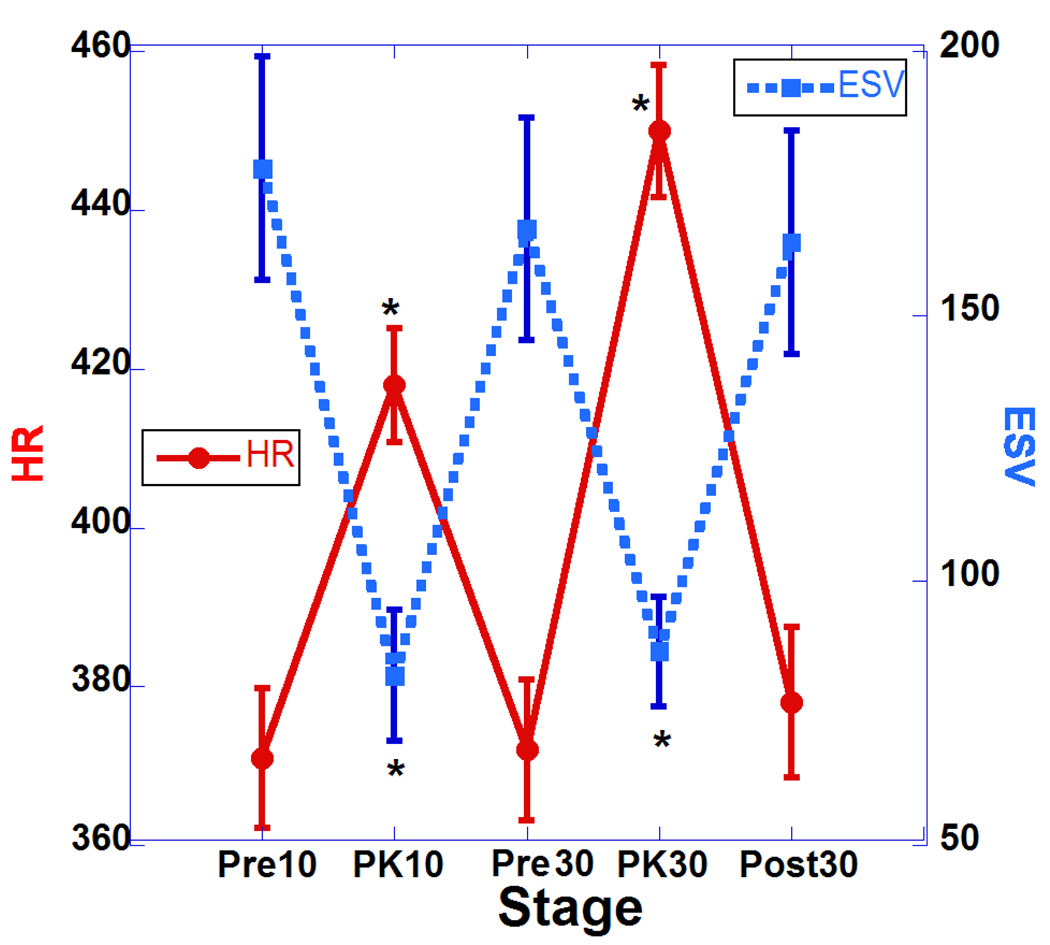
Figure 3.
Plot of heart rate (HR) and end-systolic volume (ESV) at 5 points of the study. *Asterisks indicate significant difference compared to pre-challenge baseline (p <0.05, actual p values are shown in Table 1). Error bars represent standard errors of the mean.

