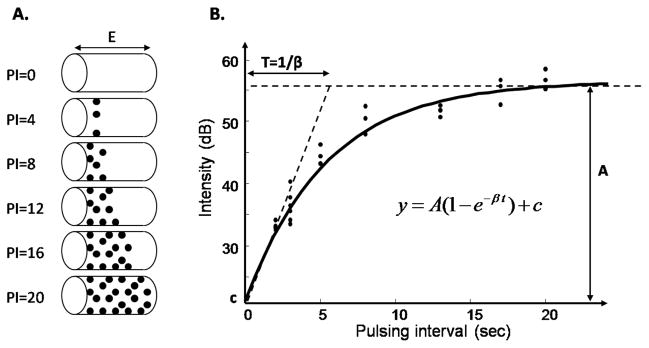
Figure 1.
Replenishment curve. A. The thickness of the ultrasound beam is represented as E. At PI = 0, all the microbubbles are destroyed by the first ultrasound pulse of ultrasound. As the pulsing interval is increased, more microbubbles reappear. B. The mean intensity within the ROI is plotted versus the pulsing interval. The parameter A is a measure of MBV.

