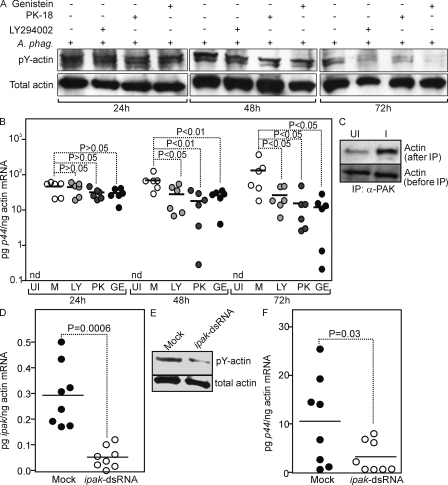
Figure 2.
Ixodes PI3K, PAK1, or tyrosine kinases affect A. phagocytophilum–induced actin phosphorylation and bacterial loads in tick cells. (A) Tick cells treated with PI3K (LY294002), PAK1 (PK-18), or tyrosine kinase (Genistein) inhibitors were infected with A. phagocytophilum (A. phag.) and assessed for actin phosphorylation at 24, 48, and 72 h. Phosphorylated (pY-actin) and total actin (loading control) were analyzed by probing with pTyr-specific and actin-specific antibodies, respectively. Mock samples were treated with equal amounts of DMSO. Representative data from two independent experiments is shown. (B) A. phagocytophilum burden in tick cells was measured by quantifying p44 mRNA levels normalized against tick β actin mRNA. UI, uninfected; M, mock; LY, PI3K-inhibitor; PK, PAK1-inhibitor; GE, Genistein; nd, nondetectable. Each circle represents one independent experiment. (C) Whole infected (I) or uninfected (UI) tick cell extracts were immunoprecipitated (IP) with PAK1-specific antibody and immunoblotted for actin. Total cell lysates (before immunoprecipitation) probed with actin-specific antibody served as the loading control. (D) Q-RT-PCR showing reduced ipak1 mRNA levels in ipak1-dsRNA–injected ticks compared with the mock controls (buffer alone). Each circle represents one tick. (E) Phosphorylated (pY-actin) and total actin levels (loading control) from tick lysates were analyzed by immunoblotting with pTyr-specific and actin-specific antibodies, respectively. (F) The A. phagocytophilum burden in ticks was measured by quantifying p44 mRNA levels normalized against tick β actin mRNA. Each circle represents an individual tick. Statistics were performed using the Student’s t test and the p-value is shown. Representative data from three independent experiments is shown. Horizontal bars in B, D, and F indicate mean values of the data points.

