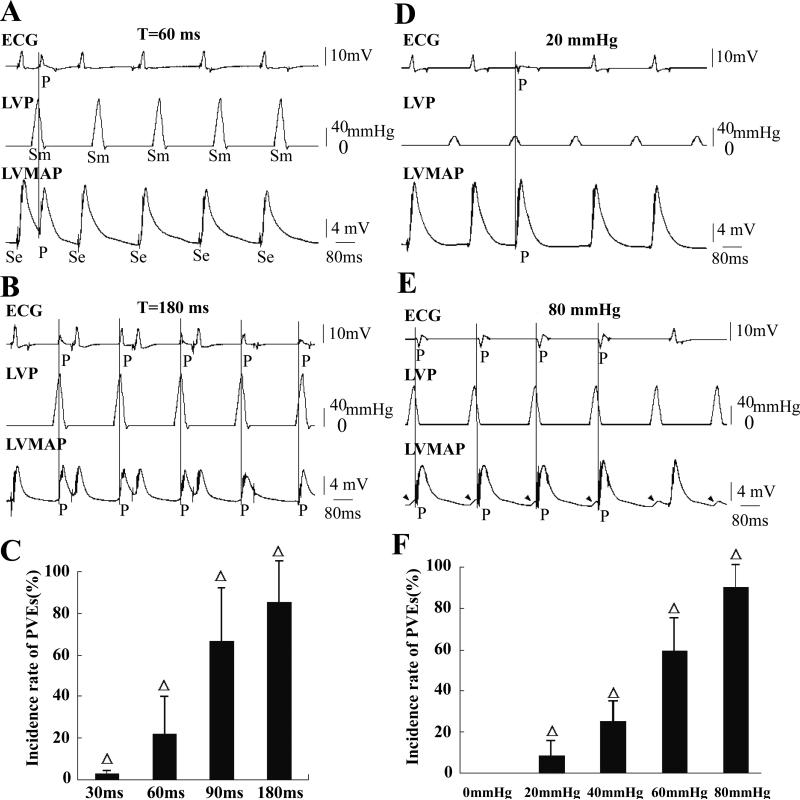
Figure 3. Effects of pressure pulses when holding ventricular pressure at 0 mmHg.
The ventricle was electrically paced at a cycle length of 260 ms. P denotes a PVE caused by pressure stimulation and the vertical line marks the time of PVE occurrence. In this figure LVP was held at a background 0 mmHg. The electrical pacing artifact (Se) and the mechanical stimulus (Sm) are marked only in A. Pressure pulses of 120 mmHg were delivered with coupling intervals (T) of 30, 60, 90 and 180 ms. Only records for T= 60 ms and T=180 ms are shown in A and B, respectively. PVE incidence increased as T lengthened from 30 to 180 ms (C, n=15, Δ: P<0.01 vs each other). In D and E, the left ventricle was exposed to pressure pulses of 20 and 80 mmHg delivered at T=180 ms, respectively. More PVEs were induced by the larger pressures (F, n=15, Δ: P<0.01 vs 0 mmHg group and each other). In E, stretch activated depolarizations (SADs) marked with arrowheads and four were followed by PVEs.

