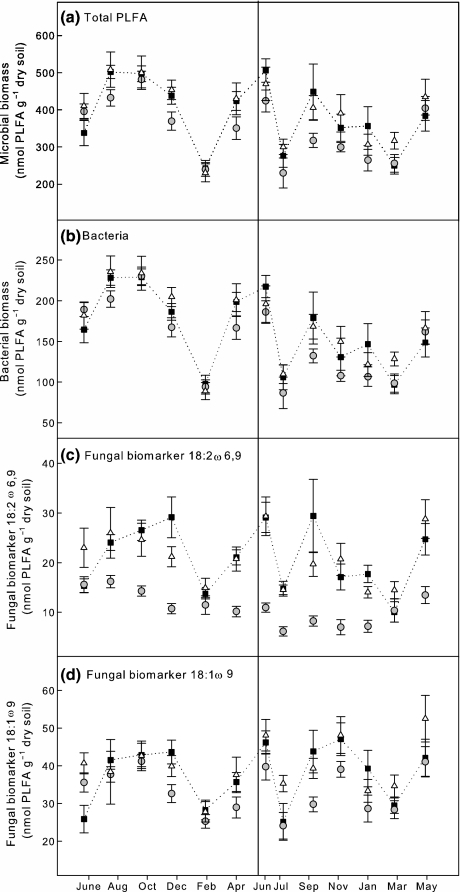
Fig. 5.
Total phospholipid fatty acid (PLFA; a), bacterial (b) and fungal (c, d) biomarkers in control, girdled and fertilized plots over a period of 2 yr (squares, controls; circles, girdled plots; triangles, fertilized plots; dotted lines connect control values to show the seasonal trend). All data are plotted on the actual sampling date; ticks are for the 15th day of each month. Error bars indicate 1 SE (n = 6).

