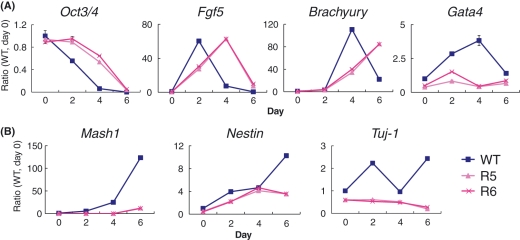
Figure 5.
Kinetics of marker gene expression under a neural differentiation condition. mRNA levels of marker genes in the control (WT; blue) and Hes1-sustained embryonic stem cells (R5 and R6; red) under a neural differentiation condition were analyzed by quantitative real-time PCR. Each value was given in the ratio to the wild-type cells (WT) on day 0. (A) mRNA levels of marker genes, Oct3/4, Fgf5, Brachyury and Gata4. (B) mRNA levels of neural marker genes, Mash1, Nestin and Tuj-1.

