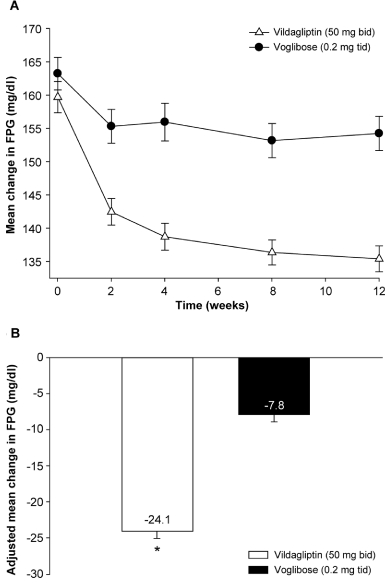
Figure 3.

Panel (A): change in mean (±s.e.) fasting plasma glucose (FPG) during the 12-week treatment with vildagliptin 50 mg bid (open triangles) or voglibose 0.2 mg tid (closed circles). Panel (B): least square mean (±s.e.) change in FPG at endpoint under treatment with vildagliptin 50 mg bid (white bar) or voglibose (black bar). 140 and 160 mg/dl are equivalent to 7.8 and 8.9 mmol/l, respectively. *p < 0.001 vs voglibose.
