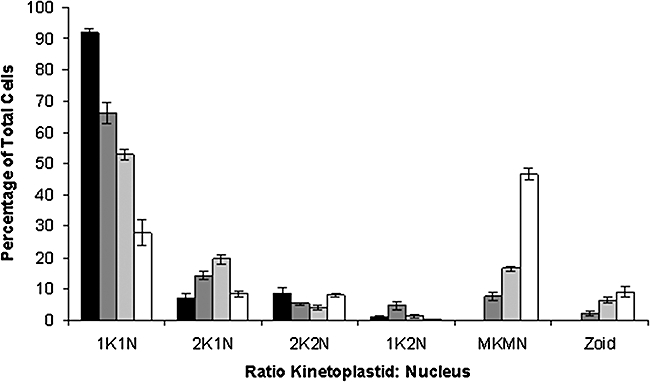
Fig. 5.

PTR1 depletion results in changes to cell cycle progression. Microscopic analysis of DAPI stained RNAi cells of non-induced (0 h) and induced (24, 48 and 72 h) populations analysed to determine the proportion of trypanosomes with different numbers of kinetoplasts (K) and nuclei (N). Percentage bar chart depicts changes in the K/N content per cell after tetracycline induction of RNAi. Approximately 300 parasites per population were analysed (n = 2, ± SD): non-induced control (black bars); 24 h induction (dark grey bars); 48 h induction (light grey bars) and 72 h induction (white bars).
