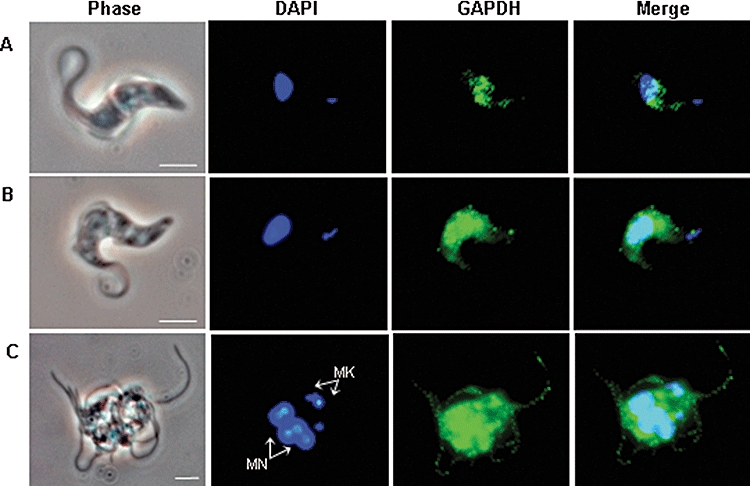
Fig. 8.

The effect of PTR1 depletion on the subcellular distribution of the glycosomal matrix enzyme, GAPDH by immunofluorescence microscopy. Non-induced (A), induced 48 h (B) and 72 h (C) RNAi cells were labelled with a glycosomal matrix marker, GAPDH (green) with staining of nuclear and kinetoplast DNA by DAPI (blue). MN, multinucleated, MK, multikinetoplastid. Scale bar represents 10 µm.
