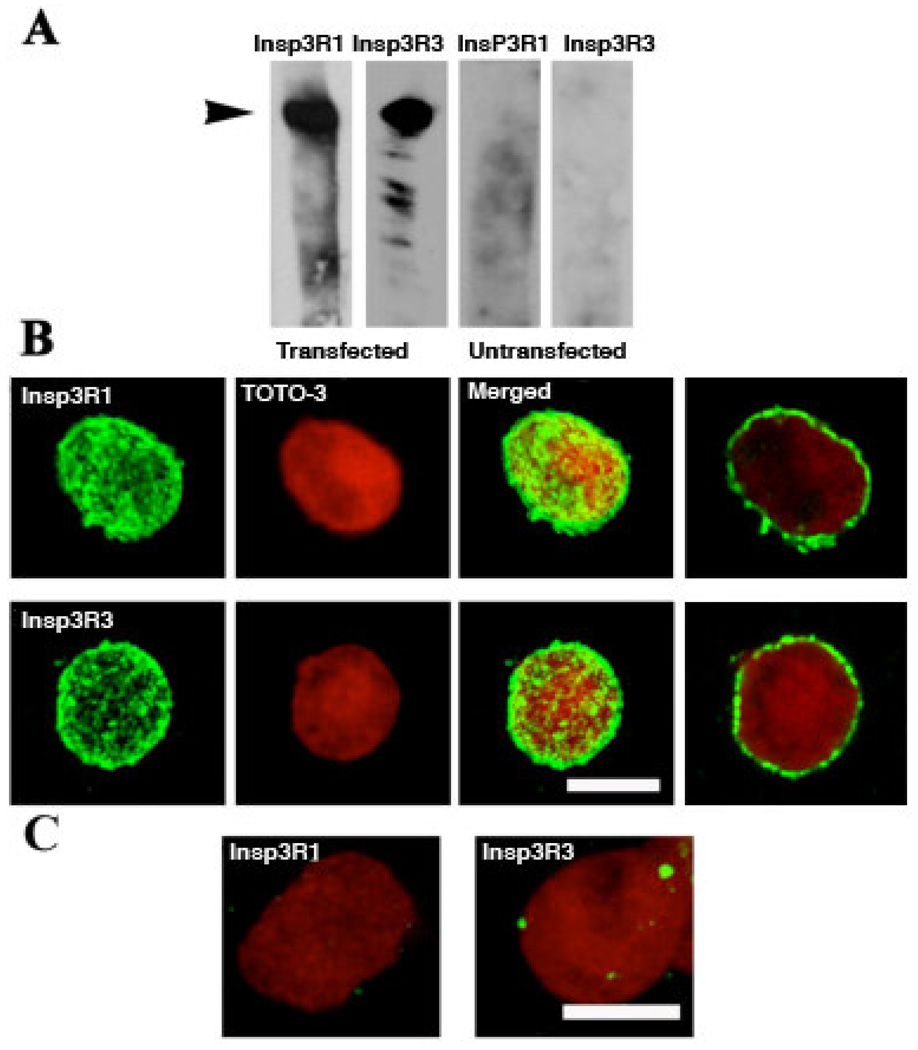
Figure 2. Heterologous expression of rat types 1 and 3 InsP3R in two separate sets of Sf9 cells.
A. Western blots of whole cell homogenates probed with specific anti-type 1 or -type 3 antibodies, revealing intense bands at ~240 kDa corresponding to the InsP3R specifically expressed in the infected cells. B. Images of isolated nuclei from either type 1 (IP3R1) or type 3 (IP3R3) InsP3R expressing cells, labeled with their respective antibodies. The first three figures in each row were produced by summing stacked confocal images of single optical sections ~ 0.5 µm thick. Both InsP3Rs (green) present a patchy distribution over the nucleus that was counterstained with TOTO-3 (red). Individual optical sections (at right) show that antibody labeling is at the periphery of the nucleus. C. Merged images, as in (B), but showing nuclei from untransfected cells. Scale bar, 10 µM.

