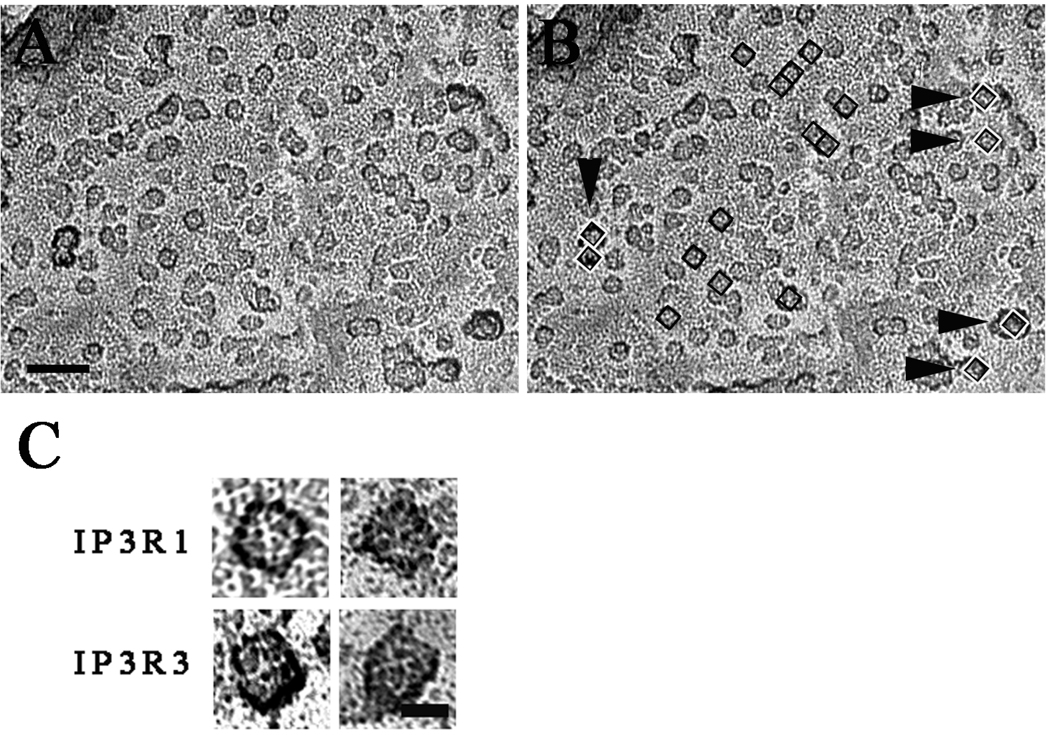
Figure 4. Counting InsP3R-like structures.
A and B show electron micrographs of the same area of a nuclear envelope from a cell over-expressing type 3 InsP3R. In B, small squares with inside dimensions of 15×15 nm are superimposed on some of the presumed InsP3R profiles. The profiles thus selected, even though not exactly “square”, fit well within the square outlines and some have a central depression. Additionally they all have similar height as indicated by the equal intensity of the platinum shadow at their edges. Numerous other particles with similar characteristics are seen in the same image. Arrowheads point to profiles that are clearly different: they are mostly larger, with a more variable shape and a darker shadow outline, indicating taller structures. The 15×15 nm black and white squares superimposed on these structures cover them only partially. Scale bar= 50 nm. C) High magnification views of InsP3R-like structures from nuclei of cells over-expressing type 1 and 3 InsP3Rs. The four particles shown here have equal sizes and an approximate square outline, but this is emphasized by the shadow only in the two particles at left. The hint of four subunits and a small central depression are typical details of the cytoplasmic domain in InsP3Rs images obtained by single particle analysis [38,39,40]. Scale bar, 10 nm.

