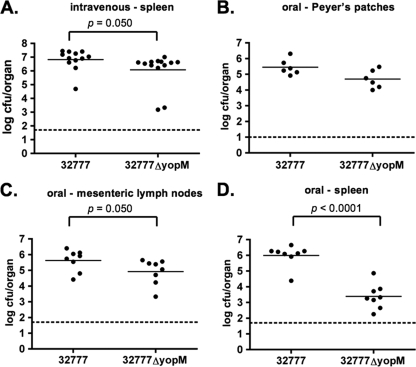
FIG. 3.
Organ colonization assays of C57BL/6J mice at 4 days postinfection. (A) Splenic colonization following intravenous Y. pseudotuberculosis 32777 or Y. pseudotuberculosis 32777ΔyopM infection. (B) Peyer's patch colonization following orogastric Y. pseudotuberculosis infection. (C) MLN colonization following orogastric Y. pseudotuberculosis infection. (D) Splenic colonization following orogastric Y. pseudotuberculosis infection. Each filled circle represents the log10 CFU per organ recovered from a single mouse. The horizontal line represents the mean colonization level, while the dashed line is the detection limit for each organ. Results are pooled from two to four independent experiments.

