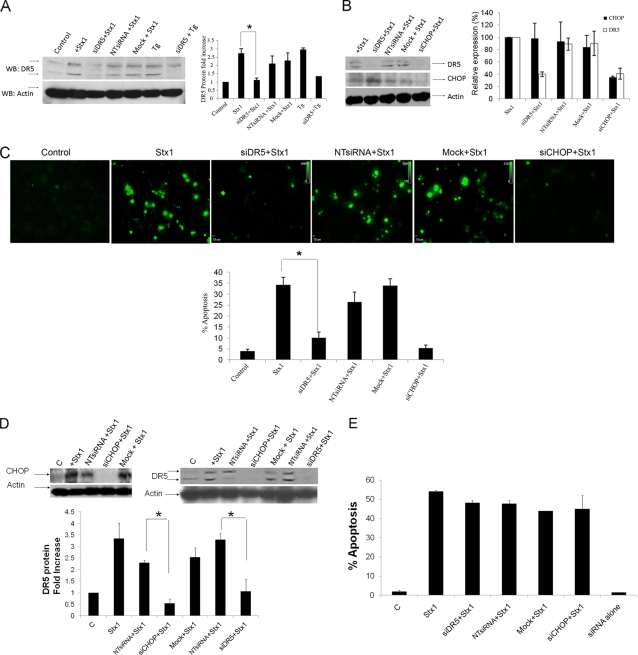
FIG. 5.
Silencing of DR5 and CHOP expression reduces CHOP-dependent expression of DR5- and Stx1-induced apoptosis in macrophage-like, but not monocytic, THP-1 cells. (A and B) Differentiated THP-1 cells were transfected with or without 200 pmol siRNA duplexes targeting DR5 (siDR5) or CHOP (siCHOP) or with nontargeting siRNA duplexes (NTsiRNA) as described in Materials and Methods. After 72 h, cells were exposed to Stx1 for 8 h, followed by Western blotting using anti-DR5 (A and B) and anti-CHOP (B) antibodies, which recognize 46-kDa (precursor form)/41-kDa (mature form) and 29-kDa proteins, respectively. β-Actin was used as an equal-protein-loading control. The bar graphs show the quantitative analysis (means ± SEM) of DR5 or CHOP protein expression from three independent experiments. *, significant difference in DR5 protein expression (P < 0.01; Stx1 versus siRNA DR5 plus Stx1 treatment). (C) Effect of DR5 or CHOP knockdown on apoptosis of macrophage-like THP-1 cells. Differentiated THP-1 cells were transfected with DR5 siRNA (siDR5), CHOP siRNA (siCHOP), or nontargeting siRNA (NTsiRNA) or without siRNA (mock) for 72 h, followed by Stx1 treatment for another 24 h. Cells were fixed, permeabilized, and incubated with TUNEL reaction solution or DAPI to stain nuclei. Cells were visualized by fluorescence microscopy, and 10 different fields (magnification, ×20) for each treatment were selected to count total numbers of TUNEL positive cells. Total numbers of cells per field (magnification, ×20) were also counted, and the percentage of apoptotic cells above that for untreated controls were calculated as described in Materials and Methods. Upper panels, representative fields showing TUNEL-positive cells from each treatment. Lower bar graph, quantitative data showing percentage of apoptosis (means ± SEM from at least four independent experiments) for each treatment. *, significant difference (P < 0.001) for cells treated with Stx1 alone versus siDR5- plus Stx1-treated cells. (D) Monocytic THP-1 cells transfected with siRNAs specific for DR5 (siDR5), CHOP (siCHOP), or nontargeting siRNA (NTsiRNA) or mock transfected were treated with Stx1 for 5 h. Expression of DR5 and CHOP was assessed by Western blotting as outlined above. The bar graph depicts quantitative analysis (means ± SEM) of DR5 or CHOP protein expression from three independent experiments. *, significant difference in DR5 and CHOP protein expression (P < 0.01). (E) Quantitative data showing percentages of apoptosis for each treatment from the FACS scatter plots of untreated monocytic THP-1 cells, cells treated with Stx1 alone, or cells treated with siRNAs plus Stx1. Results are the means ± SEM from at least four independent experiments.

