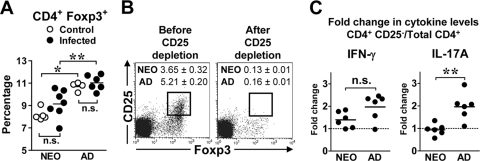
FIG. 6.
The levels of CD4+ Foxp3+ T cells in the MLN of infected adults are increased compared to infected neonates, and their presence affects cytokine production in vitro. (A to C) Neonatal and adult BALB/c mice were infected orogastrically with 2 × 10⁵ CFU of Y. enterocolitica. (A) MLN were harvested from control and infected mice at 21 days p.i.; total MLN or purified CD4+ cells were stained with anti-CD4 and anti-Foxp3 antibodies. The percentage of CD4+ cells expressing Foxp3 was quantified by flow cytometry. Each dot represents the percentage of CD4+ Foxp3+ cells from three to four individual mice in each group or CD4+ cells pooled from two to four mice. Differences were analyzed by the Mann-Whitney test. n.s., not significant; *, P = 0.016; **, P = 0.0047. (B) At 21 to 23 days p.i., CD4+ MLN cells were isolated, followed by depletion of CD25+ cells using monoclonal 7D4 antibody. CD4+ cells were stained with anti-CD25 and anti-Foxp3 antibodies before and after CD25 depletion. A representative flow cytometry profile from an infected adult is shown with the percentage ± SEM of CD25+ Foxp3+ cells from six samples in each age group. (C) Total CD4+ and CD4+ CD25− cells were cultured in vitro with splenic APC pulsed with HKY. Supernatants were collected 72 h after culture, and the levels of IFN-γ and IL-17A were quantified by ELISA. The fold change in cytokine production between CD4+ CD25− cells and total CD4+ cells for each age group is shown, and the horizontal line indicates the mean from two independent experiments (n = 6 in each group). Fold difference values greater than 1 are above the dotted line. Differences in fold change were analyzed by the Mann-Whitney test. n.s., not significant; **, P = 0.0043.

