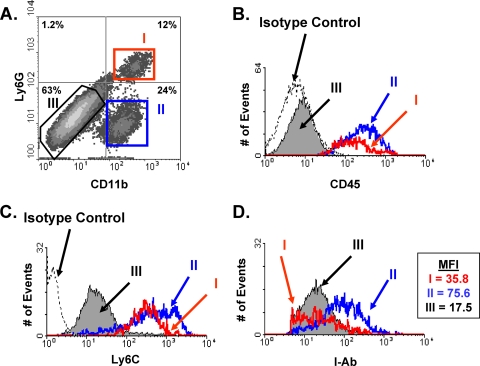
FIG. 2.
Three distinct populations of MHC class II-expressing cells in Toxoplasma-infected eyes. Mice were intravitreally injected with 104 parasites, and 6 days later, eyes were harvested and analyzed by using flow cytometry. (A) FACS plot of CD11b and Ly6G expression on MHC class II+-gated cells. The distinct populations are highlighted as I (CD11b+ Ly6G+), II (CD11b+ Ly6G−), and III (CD11b− Ly6G−). (B through D) Histograms of CD45 (B), Ly6C (C), and MHC class II (D) expression levels in each of the 3 populations. The dashed lines in panels B and C represent isotype control staining levels. MFI, mean fluorescence intensity of each population. Representative results from three independent experiments are shown.

