FIG. 3.
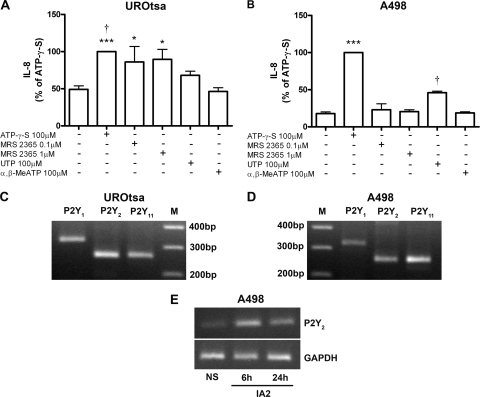
(A and B) Production of IL-8 after stimulation of UROtsa (A) and A498 (B) cells with ATP-γ-S (100 μM), P2Y1 agonist MRS2365 (0.1 and 1 μM), P2Y2 and P2Y4 agonist UTP (100 μM), or P2X agonist α,β-MeATP (100 μM) for 6 h. The amount of IL-8 produced by ATP-γ-S was set at 100%, and data are presented as means plus SEMs (error bars) (n = 3 or 5 for A498 cells and n = 5 or 7 for UROtsa cells). Statistical significance in panel A is indicated as follows: ***, P < 0.001 versus control or α,β-MeATP; †, P < 0.05 versus UTP; and *, P < 0.05 versus control or α,β-MeATP. Statistical significance in panel B is indicated as follows: ***, P < 0.001 versus control, MRS2365, UTP, or α,β-MeATP; and †, P < 0.001 versus control, MRS2365, or α,β-MeATP. (C and D) RT-PCR demonstrating expression of the P2Y1 (327-bp), P2Y2 (259-bp), and P2Y11 (260-bp) receptor subtypes in UROtsa (C) and A498 (D) cells. Lanes M, molecular size markers (in base pairs). (E) Expression of P2Y2 receptor transcript in A498 cells infected with the UPEC strain IA2. Representative results of three independent experiments are shown for RT-PCR. NS, nonstimulated cells.

