
FIG. 2.
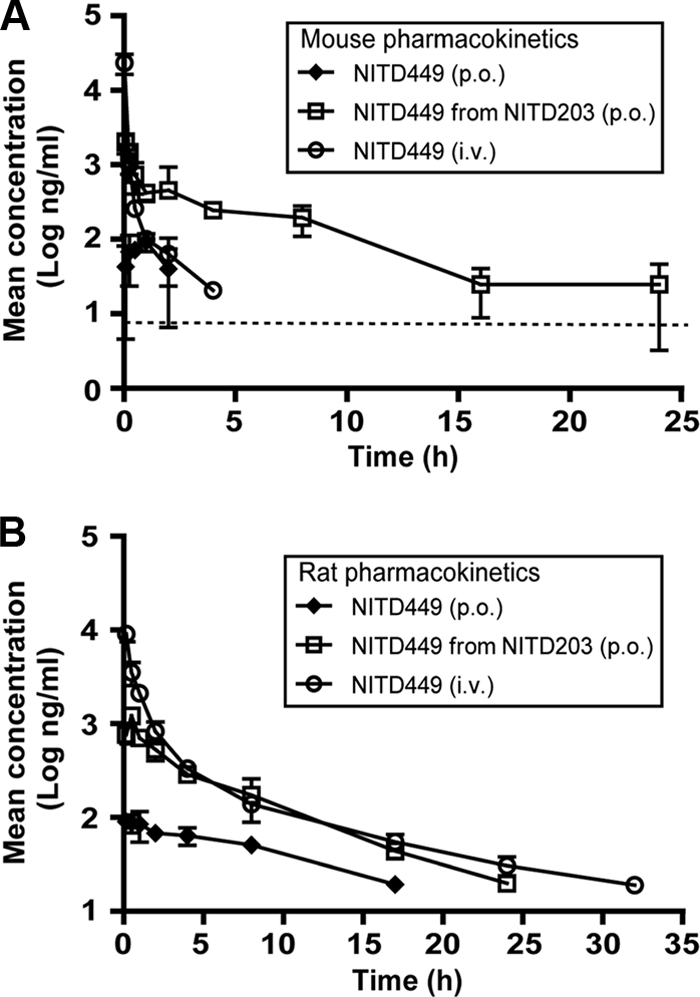
Pharmacokinetic analysis of NITD449 and NITD203. Mice (A) and rats (B) were intravenously injected (i.v.) with 5 mg/kg of NITD449, orally dosed (p.o.) with 25 mg/kg of NITD449, or orally dosed with NITD203. Plasma concentrations of NITD449 (ng/ml) over time are presented. The dotted line in panel A indicates the lower limit of quantification (LOQ); the LOQ for NITD449 and NITD203 was 9.2 ng/ml; values below the LOQ are not included in the graphs. Plasma concentrations are indicated with standard deviations (n = 3).