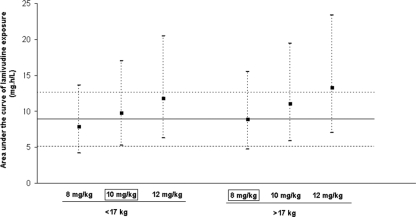
FIG. 4.
Mean area under the curve (▪) of lamivudine and 95% CI (dashed line) following different doses based on simulations of 45,000 children divided in two body weight groups. The solid line represents the target mean AUC of 8.9 mg·h/liter, and the dotted lines represent the 95% CI seen in an adult.

