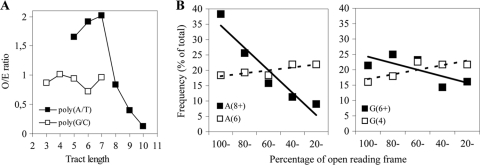
FIG. 1.
Frequency and position of homopolymeric tracts. (A) The observed frequency of homopolymeric repeat tracts is compared to the statistically expected number of such tracts in a random genome. Symbols indicate the O/E ratio for a particular tract length. (B) The position of homopolymeric adenine (left) and guanine (right) tracts in ORFs. The longest tracts are represented by filled boxes, while medium long tracts are indicated by empty boxes. Percentages indicate the extent to which an ORF is affected in case of a frameshift at the SSR locus.

