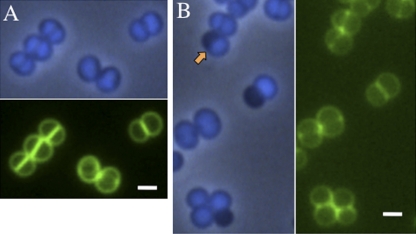
FIG. 3.
Chromosome distribution in the SA113 WT and SA113 smc::Tn917 mutant from mid-log-phase TSB cultures at 30°C. (A) SA113 WT. Newly formed equatorial rings could be visualized in two tilted cells. (B) SA113 smc::Tn917. The orange arrow indicates the “half-black cell.” The cell wall was stained with Van-FL (green), and the chromosome was stained with DAPI (blue) and visualized in the phase-contrast-fluorescent merging mode. Scale bar, 1 μm.

