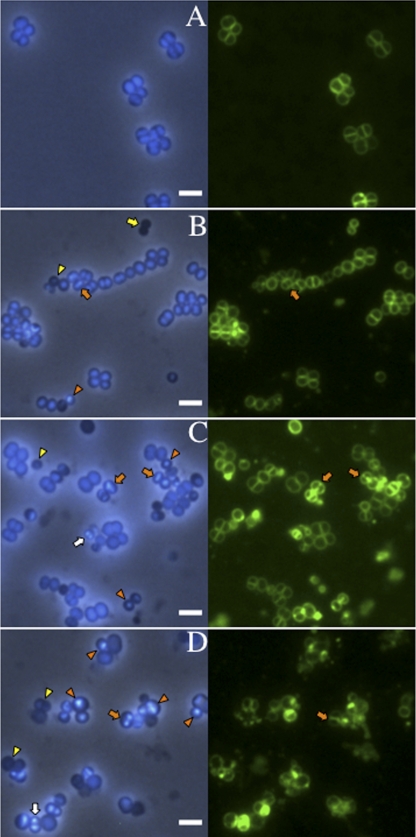
FIG. 4.
Altered chromosome morphology aggravated at higher temperatures in SA113 smc::Tn917 ΔspoIIIE. (A) SA113 WT grown for 1.5 h at 42°C. (B to D) SA113 smc::Tn917 ΔspoIIIE grown for 1.5 h after dilution of the overnight culture into fresh TSB medium at 30°C, 37°C, and 42°C respectively. DNA was stained with DAPI (blue), and the cell membrane was labeled with FM1-43 (green). Orange arrows indicate examples of the “guillotine effect,” or ‘CUT’ phenotype; yellow arrows indicate anucleate diplococci; white arrows indicate increased DNA content; yellow arrowheads indicate decreased DNA content; and orange arrowheads show the unevenly distributed nucleoid. Scale bar, 2 μm.

