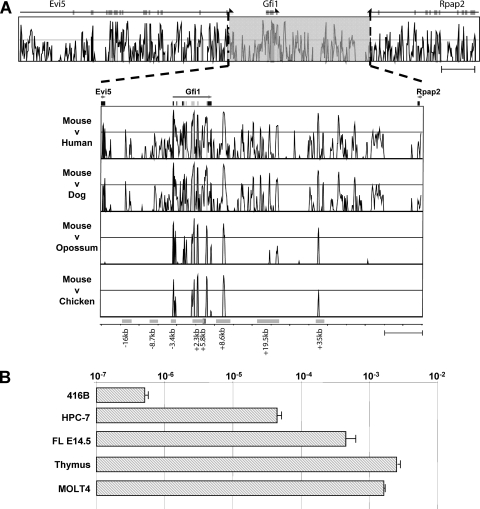
FIG. 1.
Comparative genomic analysis of the Gfi1 locus identifies eight potential regulatory elements. Extended Vista plot of sequence conservation between mice and humans of the loci of Evi5, Gfi1, and Rpap2. The expanded region of the Vista plot shows the sequence conservation across 85 kb of the mouse Gfi1 locus. The conservation plots correspond to (from top to bottom) mouse/human, mouse/dog, mouse/opossum, and mouse/chicken comparisons. The plots show conservation from 50 to 100% between the species based on a 100-bp window size. The exons and orientation of transcription are shown at the top of the figure. Potential cis-regulatory elements are highlighted by gray boxes, and the relevant names are displayed underneath. (B) Expression analysis of Gfi1 showing the mouse myeloid progenitor cell line (416B), the mouse multipotent hematopoietic progenitor cell line (HPC-7), mouse fetal liver (FL) on E14.5, an adult mouse thymus, and a human T-cell line (MOLT4). Gfi1 expression levels are displayed relative to β-actin.

