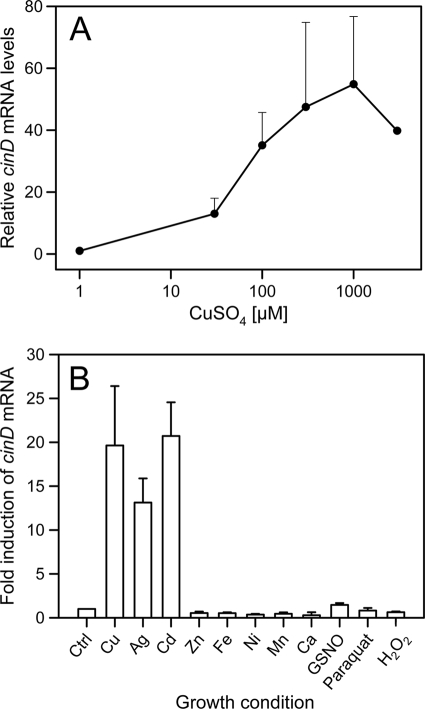
FIG. 1.
Real-time quantitative PCR analysis of cinD mRNA expression. (A) The induction of cinD mRNA was measured as a function of the copper concentration in media. Cells were grown semianaerobically and induced for 45 min with copper at the concentrations indicated on the abscissas. The error bars show standard deviations based on three independent experiments. (B) Induction of cinD mRNA was measured in response to different stress conditions. Cells were grown semianaerobically and induced for 45 min with the chemicals indicated on the abscissas. The following metal salts were used at 200 μM: CuSO4, AgNO3, CdSO4, ZnSO4, FeCl2, NiSO4, MnCl2, and CaSO4. GNSO, paraquat, and H2O2 were used at concentrations of 4 mM, 20 mM, and 1 mM, respectively. The error bars show standard deviations based on three independent experiments. All values are statistically different (P < 0.01) from each other (Kruskal-Wallis one-way analysis of variance on ranks).

