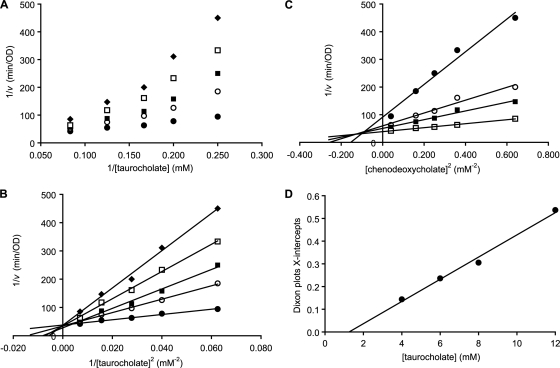
FIG. 4.
Kinetic analysis of chenodeoxycholate inhibition of C. difficile spore germination. Germination rates were calculated from the linear segment of optical density changes over time. (A) Lineweaver-Burk plots of C. difficile spore germination at various concentrations of taurocholate (4, 6, 8, and 12 mM) and 0.2 (•), 0.4 (○), 0.5 (▪), 0.6 (□), and 0.8 mM (⧫) chenodeoxycholate concentrations. (B) Squared Lineweaver-Burk plots of C. difficile spore germination at various concentrations of taurocholate (4, 6, 8, and 12 mM) and 0.2 (•), 0.4 (○), 0.5 (▪), 0.6 (□), and 0.8 mM (⧫) chenodeoxycholate concentrations. (C) Dixon plot of C. difficile spore germination at various concentrations of chenodeoxycholate (0.2, 0.4, 0.5, 0.6, and 0.8 mM) and 4 (•), 6 (○), 8 (▪), and 12 (□) mM taurocholate. (D). Replot of Dixon plot x intercepts versus taurocholate concentrations was fitted to a straight line and yielded a Ki of 1.3 mM2 for chenodeoxycholate binding.

