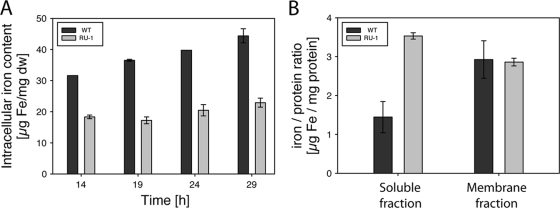
FIG. 5.
(A) Time courses of total intracellular iron content of the WT and RU-1 during growth in FSM under microaerobic conditions. Values are given as means ± standard deviations (SD) from three independent replicates. (B) Iron-to-protein ratios of WT and RU-1 nonmagnetic cytoplasmic and membrane-enriched protein fractions. Values are given as means ± SD from two independent replicates.

