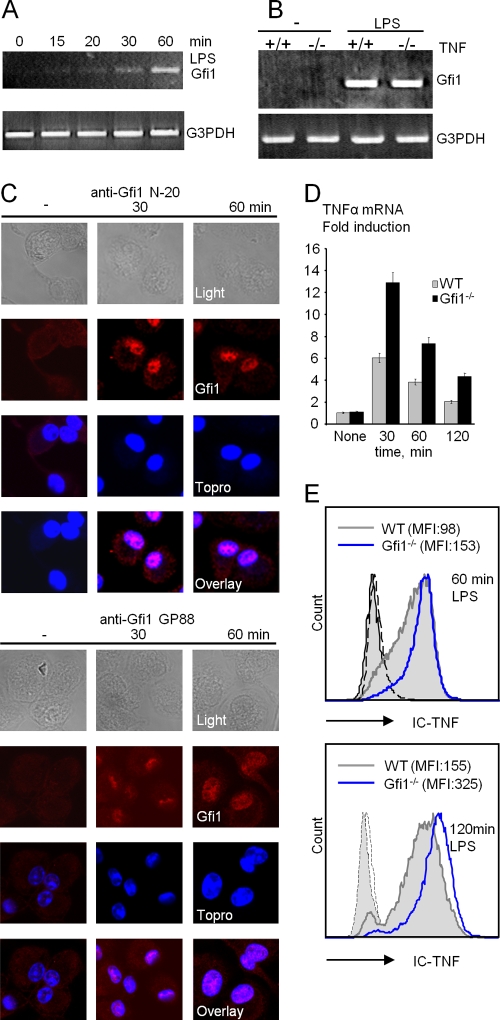
FIG. 1.
Induction of Gfi1 expression by TLR4 ligand LPS in wild-type (WT) and Gfi1-deficient (Gfi1−/−) macrophages. (A) Gfi1 mRNA expression is induced in BMDMs as early as 15 to 30 min after the onset of LPS stimulation (10 ng/ml). (B) RT-PCR analysis of LPS-induced Gfi1 expression in wild-type (+/+) and TNF-deficient (−/−) BMDMs. (C) Wild-type BMDMs were treated with 10 ng/ml of LPS for the indicated times, stained with anti-Gfi1 (left panel, N-20; right panel, GP33), and analyzed using confocal microscopy. (D) TNF-α mRNA is increased in Gfi1-deficient macrophages. Quantification by Q-PCR of Gfi1 mRNA levels using RNA from wild-type (WT) and Gfi1−/− BMDMs stimulated with LPS (10 ng/ml) for the indicated times. Representative results from three independent experiments with three independent sets of mice are shown. (E) Flow cytometric analysis of intracellular TNF-α in WT and Gfi1−/− BMDMs after LPS treatment for the indicated times. Numbers in brackets represent mean fluorescence intensities. IC-TNF, intracellular TNF-α.

