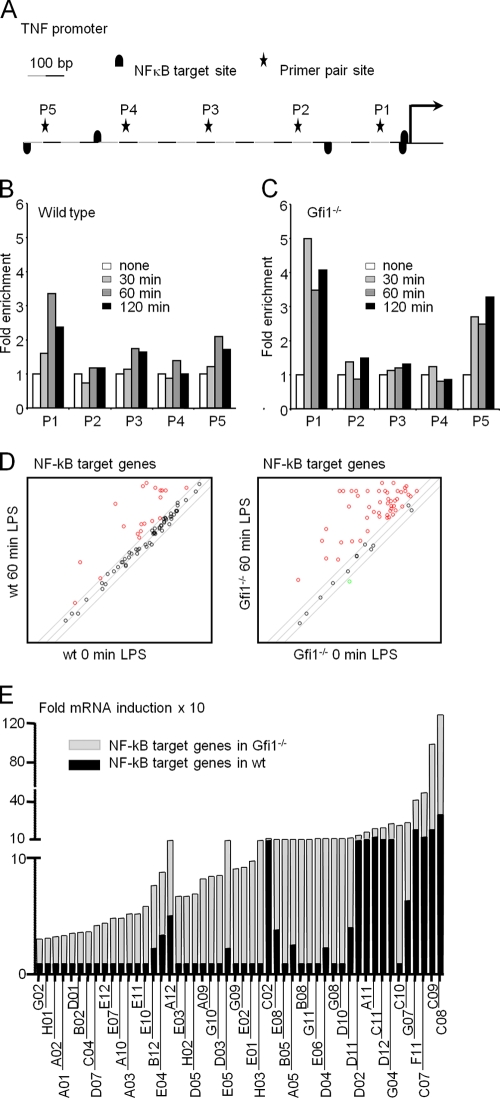
FIG. 9.
Enhanced TNF-α promoter occupancy in Gfi1-deficient macrophages and regulation of NF-κB target gene expression by Gfi1. (A) Schematic representation of 1 kb of the TNF-α promoter as assessed by ChIP analysis. Primer pair sites (P1 to P5) and NF-κB target sites are indicated. Wild-type (B) and Gfi1−/− (C) BMDMs were treated with medium or 10 ng/ml of LPS for the indicated periods of time. Cells were harvested for ChIP experiments with anti-p65 antibodies, and occupancy of p65 at the indicated sites was determined using Q-PCR with five sets of primer pairs. Data represent the average relative fold inductions at each primer site with respect to the level for nontreated BMDMs (set to 1). The data are representative of two independent sets of experiments. (D) BMDMs from wild-type (wt) and Gfi1−/− mice were stimulated with LPS (10 ng/ml) for 60 min or wereleft unstimulated (0 min). Total RNA was extracted and used for the PCR array. Scatter plot of NF-κB target genes induced 60 min after LPS stimulation in BMDMs from WT mice (left panel; red circles represent 19 genes) and Gfi1−/− mice (right panel; red circles represent 50 genes). (E) Relative fold mRNA inductions of NF-κB target genes in wild-type mice (WT; black columns) and Gfi1−/− mice (KO; gray columns). The code of each NF-κB target gene is indicated based on the manufacturer's indications for the PCR array. The gene products corresponding to the codes are indicated in Table 1.

