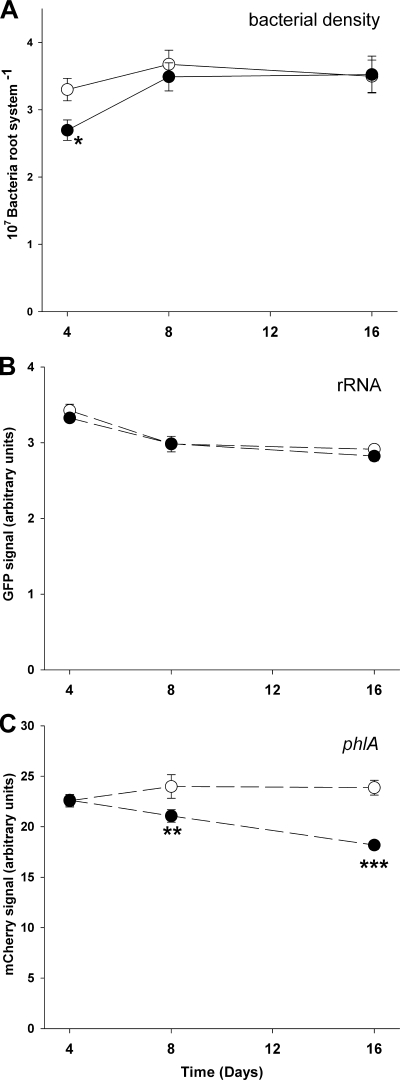
FIG. 4.
Bacterial density on barley roots (A), expression of the reporter fusions rrnBP1-gfp (B) and phlA-mcherry (C) by P. fluorescens CHA0 in the absence (○) or the presence of A. castellanii (•). Reporter activity was measured by flow cytometry 4, 8, and 16 days after inoculation and is expressed as the geometric mean of the respective fluorescence signal per bacterial cell. Error bars show ± the SE (n = 10). Asterisks indicate significant differences compared to the control (*, P < 0.05; **, P < 0.01; ***, P < 0.001 [Tukey's HSD]).

