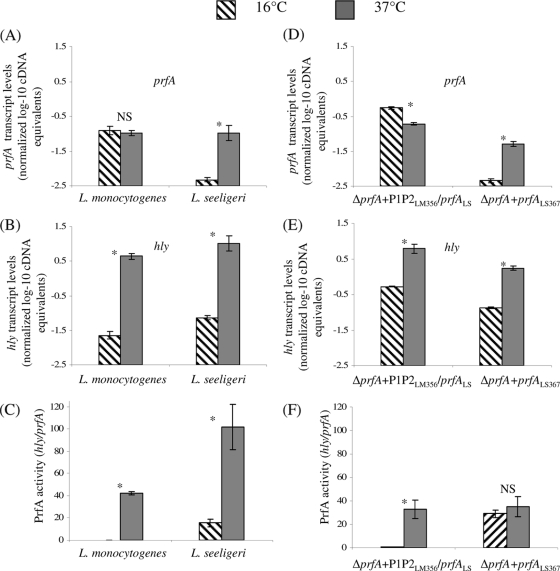
FIG. 4.
Normalized, log-transformed prfA (A) and hly (B) transcript levels and PrfA activity levels (C) in wild-type L. monocytogenes 10403S and L. seeligeri FSL S4-039, and normalized, log-transformed prfA (D) and hly (E) transcript levels and PrfA activity levels (F) in L. monocytogenes ΔprfA P1P2LM356 prfALS and ΔprfA prfALS367, all grown to stationary phase at both 16 and 37°C. Transcript levels were determined by qRT-PCR and are expressed as log cDNA copy numbers/geometric mean of cDNA copy numbers for the housekeeping genes rpoB and gap (i.e., log10 target gene − [(log10 rpoB + log10 gap)/2]; indicated as “normalized log-10 cDNA equivalents” on the y axis). Values shown represent the averages of qRT-PCR assays performed on three independent RNA collections; error bars show standard deviations of three independent biological replicates. “PrfA activity” is defined as the ratio of normalized hly transcript levels/prfA transcript levels, which indicates the activity of PrfA (measured as transcripts of the PrfA-dependent gene hly) normalized to the number of prfA transcripts; higher values thus indicate either enhanced translation or enhanced PrfA activity. Bars labeled with an asterisk (*) indicate transcript levels or PrfA activity levels that differed significantly between 16 and 37°C; NS indicates that no significant difference was found.

