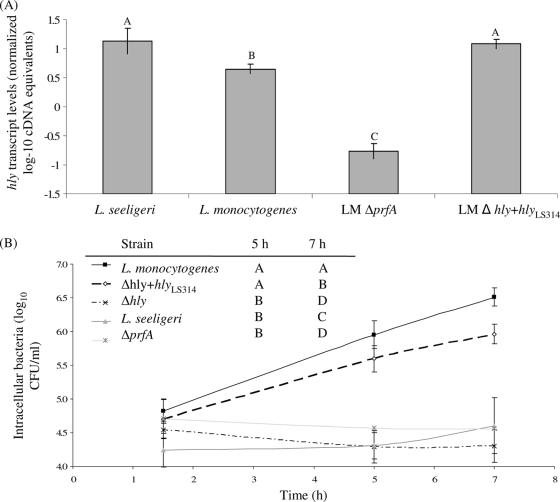
FIG. 6.
hly transcript levels (A) and intracellular growth (B) in activated J774 cells of L. monocytogenes, L. seeligeri, and L. monocytogenes Δhly hlyLS314. hly transcript levels were determined using qRT-PCR on RNA extracted from bacteria grown at 37°C to stationary phase; transcript levels are expressed as log cDNA copy numbers/geometric mean of cDNA copy numbers for the housekeeping genes rpoB and gap (i.e., log10 target gene − [(log10 rpoB + log10 gap)/2], indicated as “normalized log-10 cDNA equivalents” on the y axis. Values shown represent the averages of qRT-PCR assays performed on three independent RNA collections; error bars show standard deviations of these replicates. Transcript levels and intracellular growth for L. monocytogenes ΔprfA grown under the same conditions are included as a control (these data are also shown in Fig. 4). One-way ANOVA for hly transcript levels showed a significant effect of the factor strain on transcript levels (P < 0.0001). Statistical groupings are shown as letters above the transcript level bars. Results from the statistical analyses (one-way ANOVA comparison with Tukey-Kramer multiple-comparison correction) of growth between 1.5 and 5 h, and 1.5 and 7 h are shown in the inserted table; strains that do not share a letter (e.g., “A”) for a given time point show a significant difference in their intracellular growth levels (e.g., between 1.5 and 5 h or 1.5 and 7 h).

