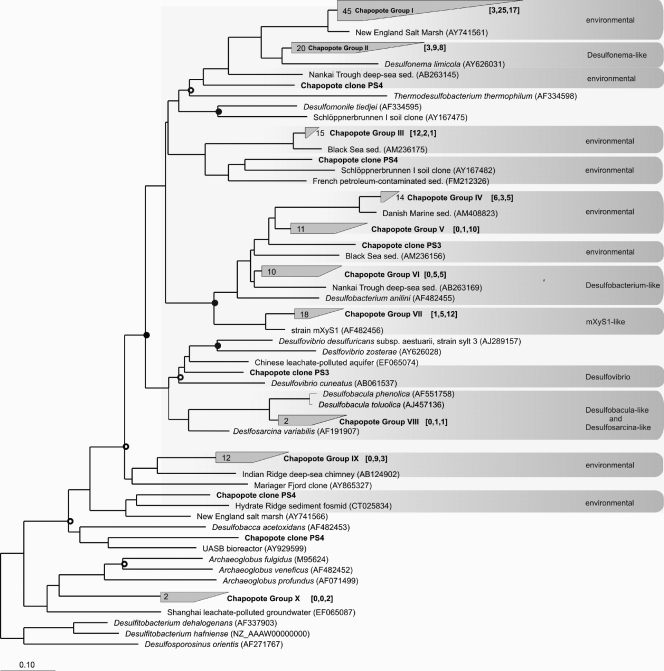
FIG. 2.
Phylogenetic tree constructed from analysis of dsrA nucleic acid sequences showing the inferred phylogenetic positions of clones from the three libraries generated using primer sets PS2, PS3, and PS4 (shown in boldface type) on sample A3. The analysis was based on approximately 600 aligned nucleic acid sequences and was calculated via distance matrix-based (Jukes-Cantor correction) analyses. GenBank accession numbers are shown in parentheses. The numbers in the brackets show the number of clones from each library, in the following order [PS2, PS3, PS4]. Gray boxes designate sequence clusters with less than 30% sequence divergence. Nodes receiving ≥50% bootstrap support are marked by open circles, while nodes receiving ≥70% bootstrap support are marked by closed circles. The bar shows 10% estimated sequence divergence. sed., sediment.

