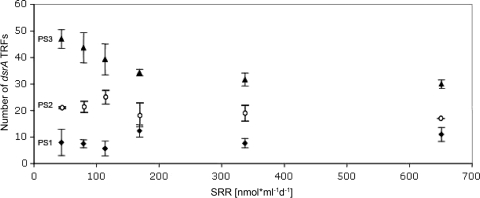
FIG. 3.
Number of TRFs and the corresponding sulfate reduction rates. Three different primer sets were applied to sediment samples from the Chapopote hydrocarbon seep, and the number of binned TRFs of each sample was plotted along an axis of sulfate reduction activity. The sulfate reduction rate (SRR) is shown in nanomoles milliliter−1 day−1. Values represent the means ± standard errors of the means (error bars) (three replicates per point).

