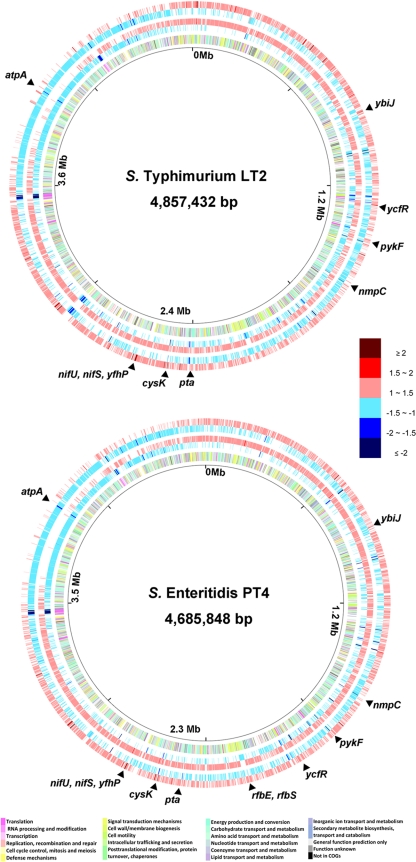
FIG. 1.
Circular maps that compare the global gene expression profiles of S. Typhimurium strain LT2 and S. Enteritidis strain PT4 under the chlorine treatments. The innermost circle gives the genomic coordinates of the LT2 or PT4 chromosome. From the inside out, the second circle shows all protein-encoding genes color coded based on clusters of orthologous groups (COGs) of proteins (see the color codes at the bottom). The third and forth circles show the downregulated (blue) and upregulated (red) genes, respectively, under strong chlorine oxidation (390 ppm for 10 min). The fifth and sixth circles show the downregulated (blue) and upregulated (red) genes, respectively, under weak chlorine oxidation (130 ppm for 30 min). All differentially expressed genes are color coded based on the fold change relative to the control experiment (see the color code on the right side). Genes selected for quantitative RT-PCR are marked at the corresponding locations on the chromosome. The circular maps were constructed using the GenomeViz 1.2 software.

