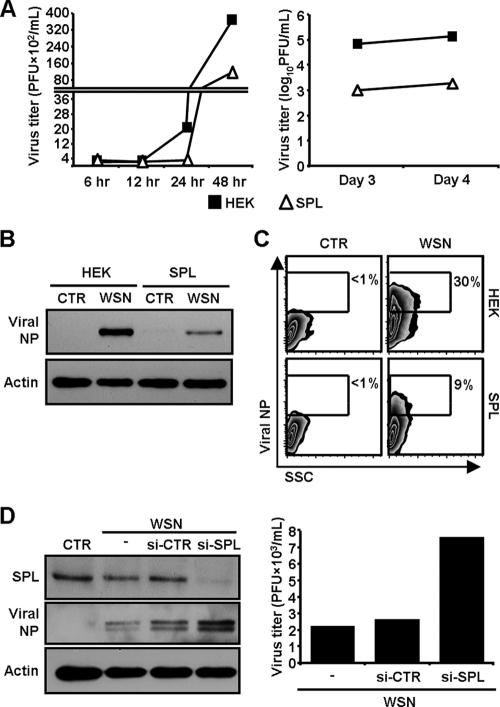
FIG. 1.
Effect of SPL overexpression on influenza virus amplification. (A) HEK cells (filled squares) or SPL cells (open triangles) were infected with WSN virus at an MOI of 0.1. At 6, 12, 24, or 48 hpi (left) and at 3 or 4 dpi (right), viral titers were determined by a plaque assay. (B) HEK cells or SPL cells were either left uninfected (control [CTR]) or infected with WSN virus at an MOI of 1. At 2 dpi, influenza virus NP and actin were detected by Western blot analysis. (C) Cells were either left uninfected (CTR) or infected with WSN at an MOI of 0.1 and were analyzed for the expression of viral NP by flow cytometry at 3 dpi. The percentages of virus NP+ cells are given. SSC, side scatter. (D) SPL cells were either mock transfected (−) or transfected with control siRNA (si-CTR) or siRNA targeting SPL (si-SPL); then the cells were infected with WSN virus at an MOI of 1. Uninfected SPL cells are shown as CTR. At 2 dpi, Western blot analysis was performed to detect SPL, influenza virus NP, and actin (left); viral titers were quantified by a plaque assay (right).

