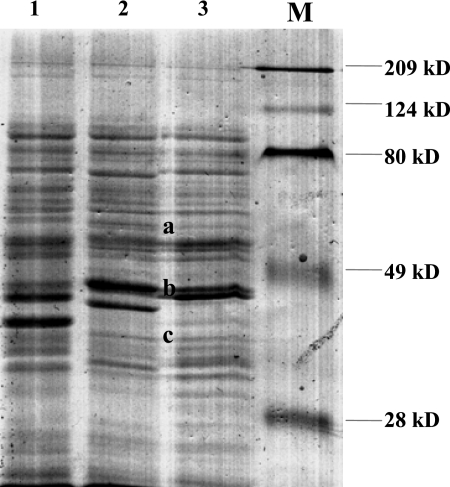
FIG. 2.
Comparison of the SDS-PAGE profiles of six oral C. concisus strains and a biopsy C. concisus strain isolated from a child with CD. Profile 1: five of the six oral C. concisus strains showed this pattern. Profile 2: one of the six oral C. concisus strains showed this pattern. Profile 3 is the pattern of a biopsy C. concisus strain from the same child who yielded the isolates with profiles 1 and 2. Protein bands a to c are common to one oral C. concisus strain and the biopsy strain from the same child. Lane M, molecular size markers.

