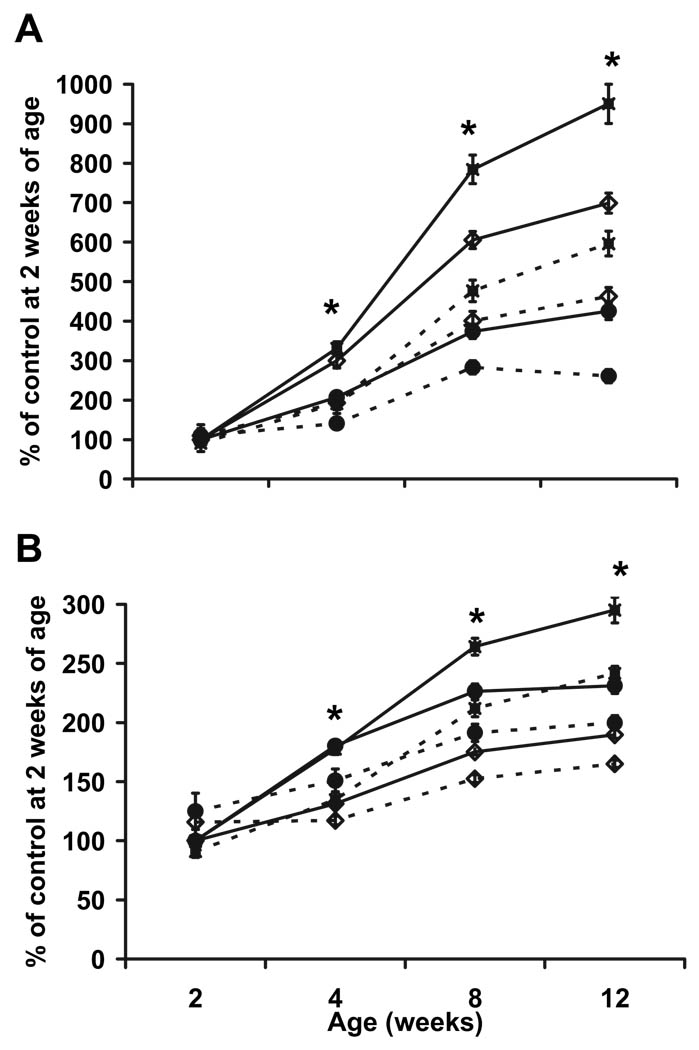
FIG. 6.
Reduced BMC (A) and BMD (B) in conditional mutant mice between 2 and 12 wk of age (n = 7–12 for 2 wk of age; n = 17–19 for 12 wk of age). All data are expressed as mean ± sem. Solid line with closed square, Control femur; dashed line with closed square, conditional mutant femur; solid line with closed circle, control vertebrae; dashed line with closed circle, conditional mutant vertebrae; solid line with open triangle, control total body; dashed line with open triangle, conditional mutant total body. *, Significant difference between conditional mutant and control mice (P < 0.05).

