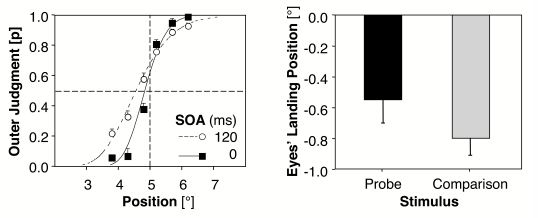
Figure 3.
Left: Mean probabilities (and standard errors between participants) for outer judgements of the probe (relative to the 5° mid-position of the comparison stimulus) as a function of the stimulus onset asynchrony (SOA). Curves are fitted functions of a Probit Analysis. A shift to the left indicates PSE (the point of subjective equality) values lower than the objective mid-position and thus a tendency to more outer judgements of the probe. Right: Mean deviations (and standard errors between participants) of eyes’ landing position to the probe and the mid-position of the comparison stimulus. Negative values indicate the amount of saccadic undershoot (Experiment 1, N = 22).

