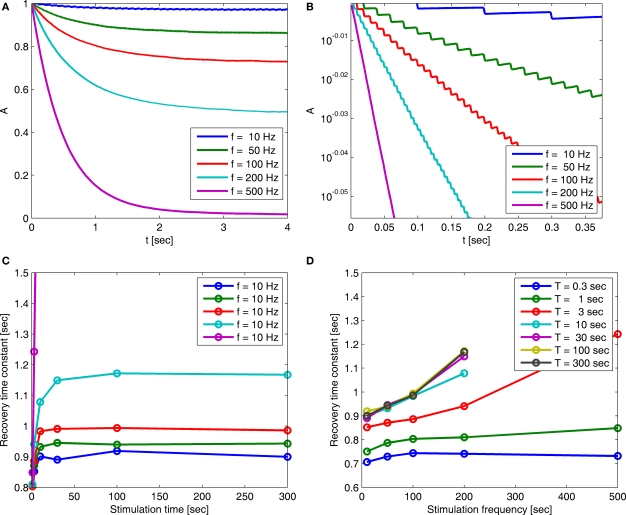
Figure 5.
(A) Entry into inactivation for different stimulation frequencies. (B) A closer look at the first 0.5 s of the entry into inactivation, on a logarithmic y-scale: each jump is caused by a single spike, while the overall trend displays an exponential relaxation, with a timescale linear in the frequency of stimulation (through which is determined by Eq. 10) (C) Recovery timescales at different lengths of spiking stimulation and for different frequencies. (D) Recovery timescales at different frequencies for different lengths of spiking stimulations. Parameters: TH = 2 ms, N = 105, γH = 2 Hz, γL = 10−4 Hz, cH = 0.2, cL = 5, t0 = 3 s and a time step of Δt = 10−3 s. Notice that for f = 500 Hz we have a continuous stimulation, and the timescale of recovery increases linearly with stimulation length, as seen in Figure 3. For spiking stimuli we observe a weak scaling with frequency (as in Ellerkmann et al., 2001), but observe no long term scaling with stimulation time for spiking stimuli. In graphs (C) and (D) we omitted some of the continuous stimulation data points (where the increase in timescale is very large) in order to facilitate a comparison between the other data points.

