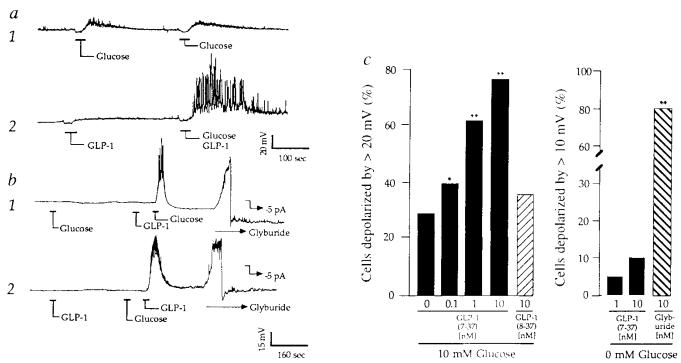
FIG. 1.
Synergism of glucose and GLP-1 to depolarize β-cells. a, Trace 1: membrane potential recordings from a β-cell exhibiting weak sensitivity to 10 mM glucose repeatedly applied for 30 s as indicated. Trace 2: recordings from the same cell during application of 10 nM GLP-1 (left) or combined application of 10 mM glucose and 10 nM GLP-1 (right). Initial resting potential (Vm)−62 mV. b, trace 1: a cel1 that initially failed to respond to 10 mM glucose, but which responded to 10 mM glucose after pretreatment with 10 nM GLP-1 (Vm −66 mV). Trace 2: a cell that initially failed to respond to 10 nM GLP-1, but which responded to 10 nM GLP-1 after pretreatment with 10 mM glucose (Vm −60 mV). The initial insensitivity of β-cells to glucose or GLP-1 did not result from their failure to express functional lKATP channels because application of 10 nM glyburide resulted in rapid membrane depolarization (42 ± 11 mV, ±s.e.m., n = 10 cells), as illustrated (b, traces 1,2). b, −5 pA of hyperpolarizing pipette current was applied to repolarize the membrane after application of 10 nM glyburide. Repolarization confirms the integrity of the membrane/pipette seal. c, Cumulative dose–response analysis summarizing the interaction of glucose and GLP-1 to depolarize β-cells. The action of GLP-1(7-37) but not GLP-1(8-37) exhibited dose-dependence under conditions in which the test solution also contained 10 mM glucose (left). In contrast, the action of GLP-1(7-37) but not 10 nM glyburide was abrogated when the test solution contained no added glucose (right). Statistical significance was determined by Student's t-test. Probability values (*P ⩽ 0.05, **P ⩽ 0.005) are expressed relative to control (10 mM glucose and no GLP-1). c, The number of cells tested was 50 for GLP-1(7-37) and 10 mM glucose, 25 for GLP-1(8-37) and 10 mM glucose, 20 for GLP-1(7-37) and 0 mM glucose, and 20 for glyburide and 0 mM glucose. The EC50 value for GLP-1(7-37) was calculated as 1 nM by establishing a cumulative dose–response relationship in which the action of the peptide was assessed over a concentration range of 0.01–100 nM. The EC50 was defined as the concentration of GLP-1(7-37) that depolarized 50% of the cells by ⩾20 mV when the cells were simultaneously challenged with 10 mM glucose. METHODS. Islets were isolated from pancreata of male rats (200–250 g) by collagenase digestion, suspended in culture medium (RPMI 1640 containing 11.1 mM glucose, 10% fetal bovine serum, 100 μg ml−1 streptomycin, 100 U ml−1 penicillin G), and maintained in culture 1–4 days. Single-cell suspensions were prepared by trypsin–EDTA digestion and mechanical dispersion of cultured islets, and cells were plated on Falcon tissue culture dishes coated with concanavalin-A for short-term (⩾16 h) culture. Under these conditions, ⩾90% of the 10–15 μm diameter cells secrete insulin, as determined by the reverse haemolytic plaque assay16, and are therefore considered to be β-cells. The fact that ~80% of our cells responded to glyburide indicates that the primary rat cell cultures are indeed enriched with β-cells. For perforated-patch recordings the pipette solution contained 240 μg ml−1 nystatin and (in mM): 10KCl, 10NaCl, 70K2SO4, 2MgCl2, 10HEPES (pH 7.35, 295 mOsm). In Figs 1-3 the bath solution contained 138 NaCl, 5.6 KCl, 1.2 MgCl2, 2.6 CaCl2, 10 HEPES (pH 7.35, 300 mOsm), and was maintained at 32 °C by a peltier device mounted on the stage of an inverted microscope. All recordings were obtained from solitary cells not organized in clusters, and recordings were initiated within 30 min after transfer of the cells to the glucose-free solution. Pipettes were prepared from borosilicate glass capillary tubes and fire polished to tip resistances of 2–8 MΩ. Measurements were made using an EPC-9 amplifier (bandwidth 10 kHz) interfaced with the Instrutech Data Aquisition and Analysis system (Instrutech Corp., Mineola, NY). The signal was stored on videotape, low-pass filtered (0.5–3.0 kHz, 4-pole Bessel filter, −3 dB attenuation), digitized (100 Hz for recordings of the membrane potential, 5–10 kHz for unitary current recordings), and selected recordings were sampled. Following seal formation, perforation was achieved within 5–10 min, at which time values for the series resistance (Rs), slow capacitance compensation (Cs), and the resting membrane potential were 10–20 MΩ, 6–8 pF and −61 ± 5 mV (n = 50), respectively. No correction was made for liquid junction potentials. Test substances were applied by pressure ejection from ‘puffer’ pipettes. The kinetics of this delivery system were established by measuring the rates of onset (time constant, τ, 1.5 s) and offset (τ, 10 s) of 60 mM KCl-induced depolarizations. The change in membrane potential in response to glucose or GLP-1 was measured as the difference between the resting potential and the plateau potential. GLP-1 was obtained from Scios Nova.

