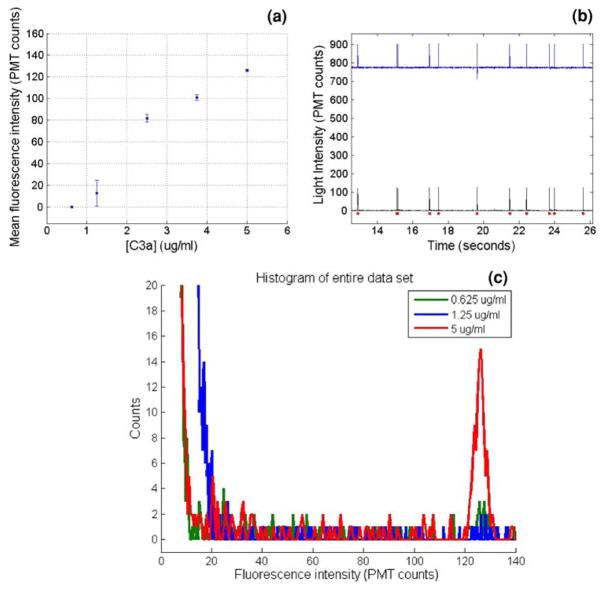
Fig. 5.
a Results from the dual incubation microimmunoassay with fully autonomous on-chip incubation and detection, showing fluorescence intensity in PMT counts versus C3a antigen concentration. b Partial PMT trace from the dual incubation experiment showing the original detected signal (top) and signal after high-pass filtering (bottom). The dots represent each peak detected by the peak finding algorithm. c Overlayed fluorescence intensity histograms of three datasets from the dual incubation microimmunoassay experiments, using C3a sample concentrations of 5, 1.25, and 0.625 μg/ml. At the lowest concentration, the intensity histogram merges completely with the baseline noise, thus representing the detection limit of the assay

